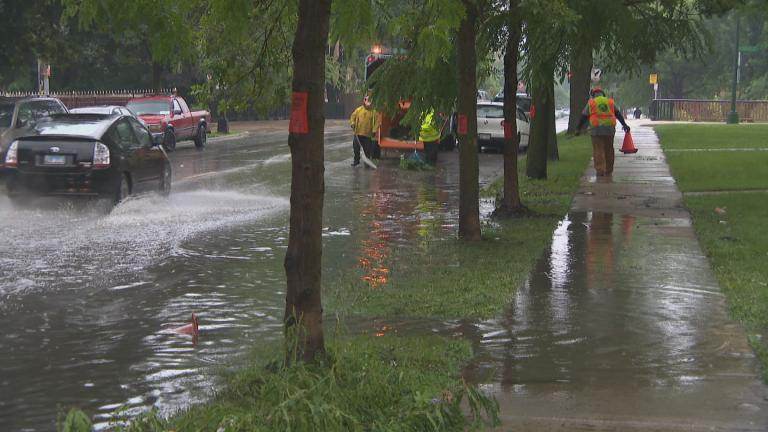
This spring, Chicago saw record rainfall for the third May in a row – and with the rain came the return of flooded streets, parks and basements across the region, despite hundreds of millions of dollars spent in the last several years on the Deep Tunnel project.
A new analysis by the Brooklyn nonprofit First Street Foundation says that 13% of properties in Chicago are highly vulnerable to flooding, and that number is only projected to rise. First Street has also launched a new data visualization tool, FloodFactor.com, that allows anyone to look up flood risks for their region.
First Street Foundation’s model combines decades of research and data to assign every property in the mainland United States what it calls a “Flood Factor” – a score from 1 to 10 that represents its cumulative risk of flooding over the duration of a 30-year mortgage.
First Street’s analysis presents a startlingly different picture from FEMA’s flood risk map, and Executive Director Matthew Eby says that’s because their model uses a more robust and forward-looking set of data, including climate data and precipitation.
“If you look at FEMA properties that are identified as being in that special flood hazard area for the city there’s only 1,500 properties that fall within that definition,” said Eby. “What our model shows is that that’s more like 77,000 properties.”
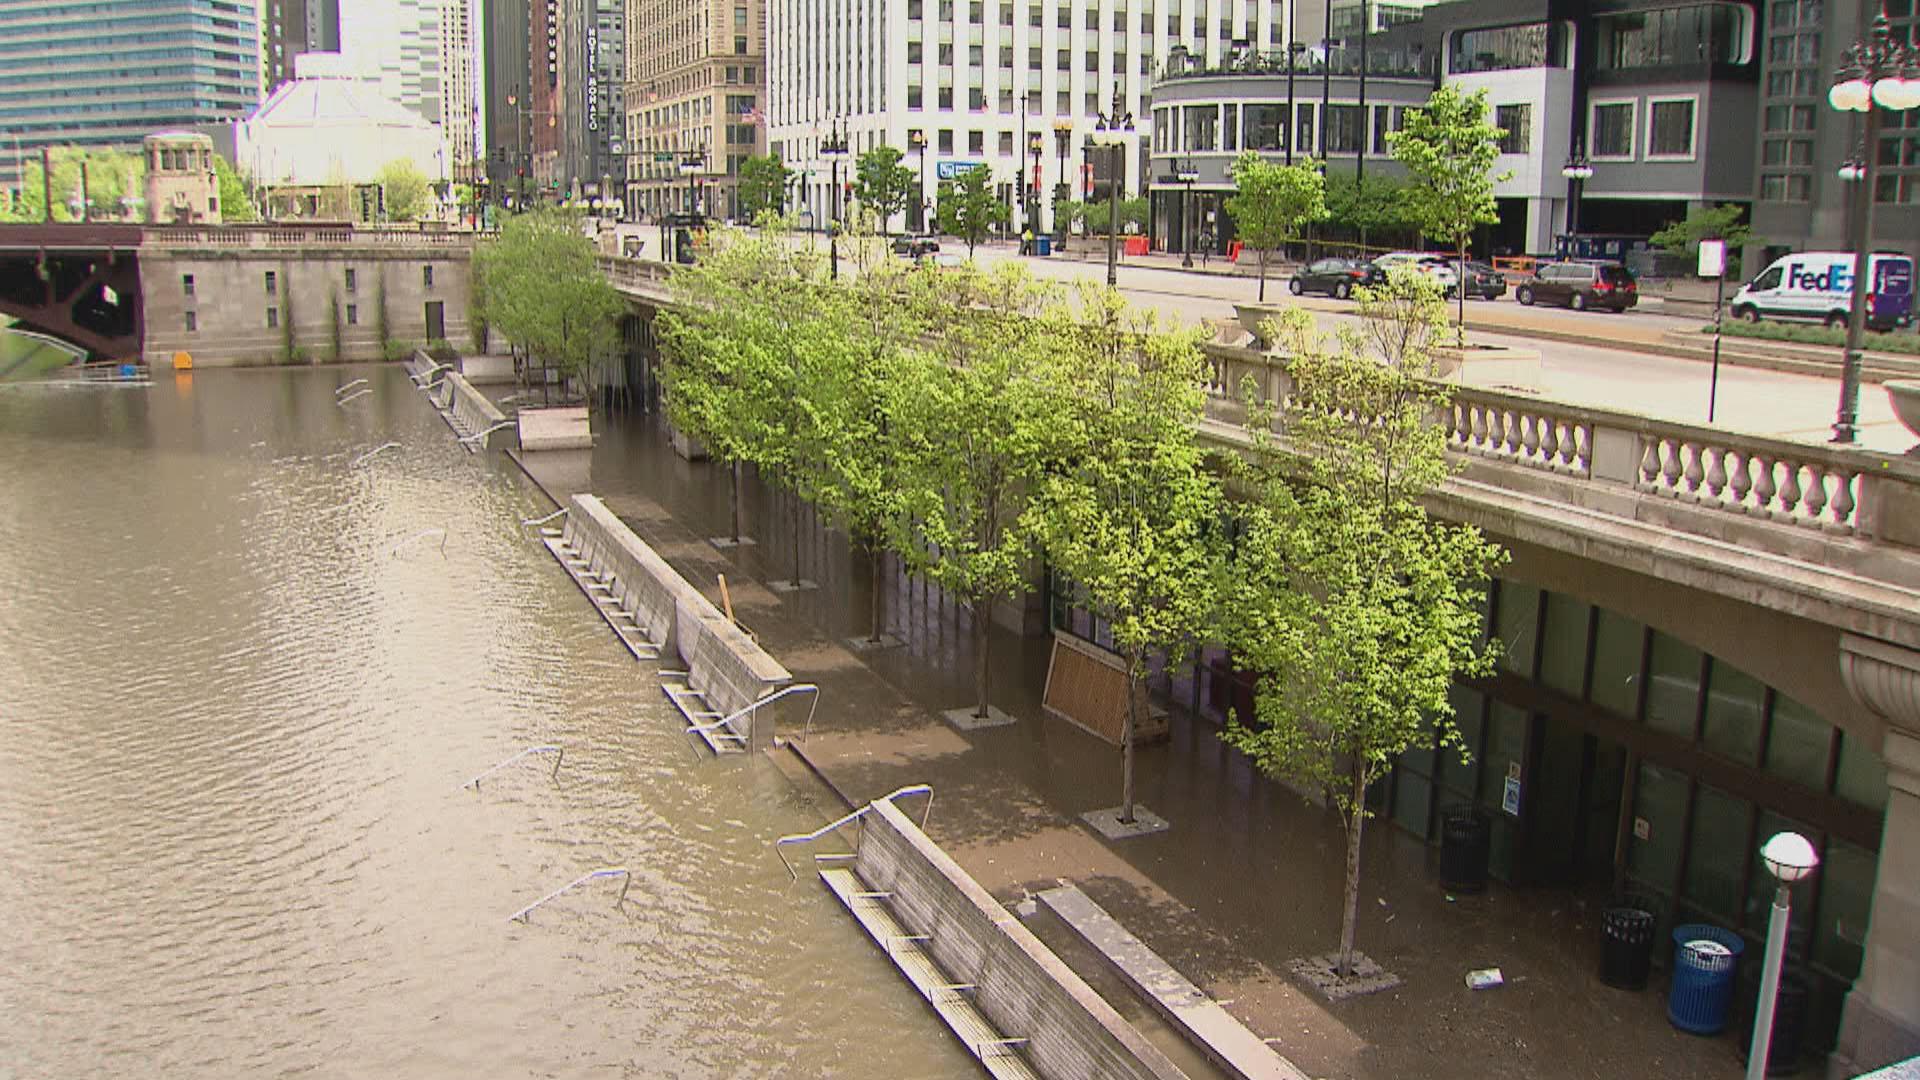 A flooded Riverwalk along the Chicago River. (WTTW News)
In Chicago, the Flood Factor map shows heightened flood risk in areas one might expect — neighborhoods surrounding the Chicago River and on the lakefront, for instance – but also in neighborhoods like Wicker Park and Englewood that aren’t proximate to any bodies of water.
“In our model we look at a few different types of flooding – so we look at fluvial flooding, which is riverine flooding, we look at hurricane storm surge, and those two things would be concentrated around the ocean or lakes and rivers, but we also map something called pluvial flooding,” Eby said. “Pluvial flooding is precipitation events. The intensity, frequency and duration of those events has been going up over time, so that’s what you see in those pockets inland. Those lower-elevation areas where there’s a whole bunch of rain that comes down on this impervious surface because it’s a city and the water can’t absorb into the ground so then it runs to the lowest point and if an overwhelmed sewer system can’t handle that volume of water, that’s when you see the depths start to pile up and why those pockets exist.”
If a 1% annual risk of flooding sounds insignificant, Eby says it’s important to understand the context of annual likelihood.
“When people think of flood risk they always think on an annualized basis, or a 1% as it’s called, which means in their minds, they could think that happens once every 100 years. But actually it doesn’t work like that,” Eby said. “It has the likelihood each year of happening 1%. So if you have a home for 30 years … you have that 1% risk every year. … So it’s like having a giant roulette wheel with 10 numbers on it, and every year you’re spinning that wheel and you’re hoping it doesn’t land on your number. But if you do that for 30 years … the likelihood of that happening is actually 26%, or one in four.”

